24th May,2007,Central-South Hydropower Investigation and Design Research Institute performed the remote survey by the Lensphoto software in Dingqu River of Derong County which is located in the borderland between Szechwan and Tibet. This case approved that the Lensphoto software could be applied in remote large-scale survey with a high precision out of the close range.
1.External data capturing:photo taking and the reference points'survey.
The area of the mountainous survey region: the width was more than 500m, height more than 300m,the forest distance between the camera station and the survey region more than 1500m and the difference between the far scene and the close scene about 500m. They were depicted as the following graph:
Graph 1:
Because that the height of survey region was more than 300m,the camera must be held breadthwise,the factual height of the image format was more less than 300m and the data was captured respectively in up and down aerial strips.
⑴The camera type: Kodak DCS Pro SLR/n, the image format was 36*24mm (4500*3000pixels),the pixel’s size was 8mm and the lens focus was 135mm.
⑵The reference points'setting up:16 sign boards in all with a size 60cm*60cm.
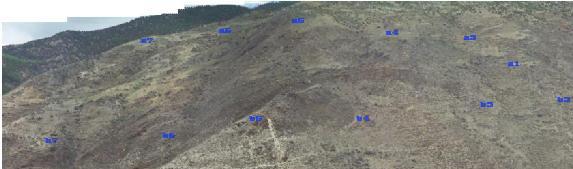
The reference points'distribution graph in the whole survey region (the reference points were divided into up, middle and down three layers):

⑶The camera stations'selection:the photographic distance was more than 1000~1500m. Three camera stations were set up in the roadside with a height about 30m and a space between every camera about 85~100m according to the terrain condition (the space is 1/10 of the photographic distance in photographic criterion). Photos were taken in every camera station respectively,so 36 photos were taken in the whole survey region in all with 18 photos in the first aerial strip and 18 photos in the second aerial strip.
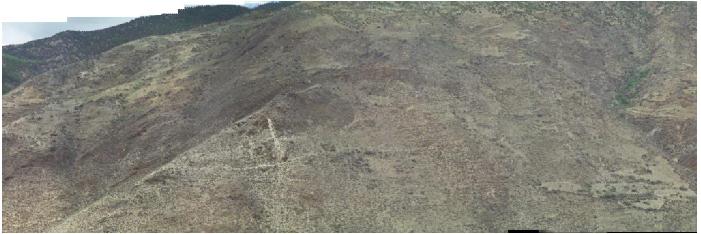
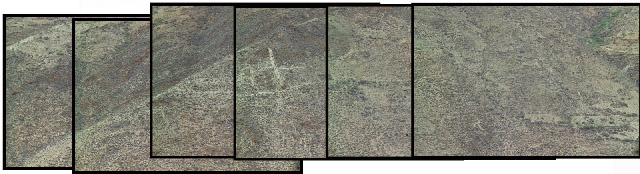
The panoramic image of the first aerial strip:
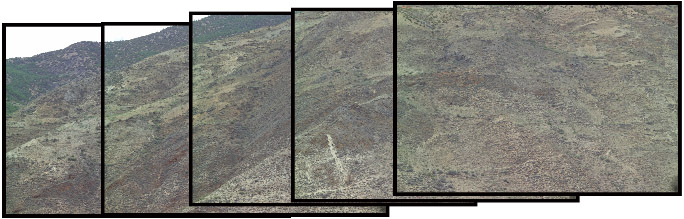
The image taken in a camera station:
The precision report:
The number of reference points |
The number of check points |
rms (m) |
Relative precision in depth |
Relative precision
in Y direction |
Relative precision
in X direction |
X
[ depth] |
Y |
Z |
6 |
6 |
0.0312 |
0.0420 |
0.0216 |
1/32267 |
1/23970 |
1/46608 |
The panoramic image of the second aerial strip:
The image taken in a camera station:
The precision report:
The number of reference points |
The number of check points |
rms (m) |
Relative precision
in depth |
Relative precision
in Y direction
|
Relative precision
in X direction
|
X
[depth] |
Y |
Z |
5 |
4 |
0.0677 |
0.0446 |
0.0253 |
1/12139 |
1/18426 |
1/32482 |
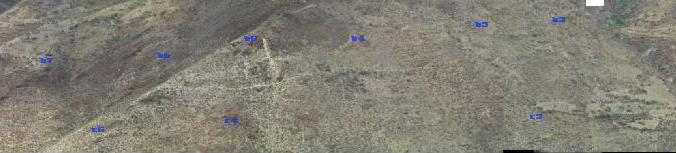
Aerial strips auto-mosaic:
The common reference points'distribution graph between the up and down strips:
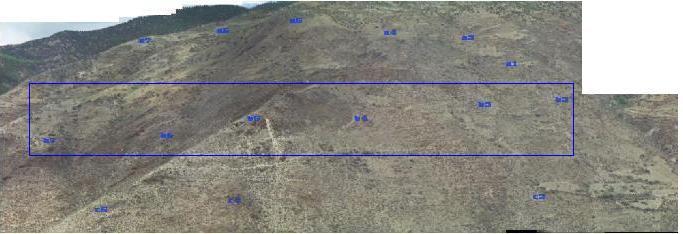
In the middle there were a row of reference points.b2, b3, b4, b5, b6 and b7 (6 in all) were the common reference points between the up and down strips, which were the points in the blue panes.
The overlap image between the up and down aerial strips (the overlap degree was about 50%)
The precision report after the aerial strips auto-mosaic and the integrate adjustment was depicted as follows:
The number of reference |
The number of check
|
rms (m) |
Relative precision
xin depth |
Relative precision
in Y
|
Relative precision
in X |
X
[depth] |
Y |
Z |
8 |
7 |
0.0316 |
0.0401 |
0.0220 |
1/30537 |
1/24064 |
1/43863 |
|